December 19th, 2017 → 2:13 pm @ WinTrader
In the world of medicine, X-rays, MRIs and brain scans help doctors to diagnose diseases. These types of tools are available in every field for help people to recognize the current conditions and receive accurate information. Similarly, in the world of investing, the graphs that is plotted with number of economic indicators will helps investors to understand what is their position now and how to get to where they want to go.
For an investor a chart that records the price and volume history of a stock is very useful for identifying the strength, health and characteristics of that particular stock. You don’t allow a doctor to open your heart and perform heart surgery if he had not utilized the critical necessary tools. Because you know well that was just a plain and irresponsible process. Investors trading process will also become irresponsible and plain if they don’t use price and volume chart for reference.
Novel investors lose money due to the lack of awareness about the stocks. They can use this chart to how to recognize when a stock tops and starts into a certain direction. So use chart to learn and interpret the price and volume pattern of stocks to make good profit.
The basics of chart reading
Based on daily supply and demand in the largest sale marketplace in the world the price performance of thousands of stocks will varies continuously. Charts records this price changes clearly and accurately. Investors who use charts in the proper way have an enormous advantage over those who refuse to learn from chart. You never ever go for a long trip without a road map. Like this charts are your investment road map.
Even if a professional regret to use charts of stocks while investing, please don’t follow them. As an individual investor learn to interpret chart properly. One who found time for this made thousands of opportunities every year. First learn to diagnose normal or abnormal price and volume movements. From this you can identify the strength and weakness of the stock. By analyzing the chart you will be able to determine whether the stock is in a proper buy position or sell position. If you find out the stock is weak you can temporarily avoid it.
Number of investors is increase on day by day. A large number of simple price and volume charts are readily available in the market. More advanced charts are now available. They will provide both fundamental and technical analysis data other than simple price and volume data. So that you can concentrate on thousands of stocks in a highly organized, time-saving way. Take extreme care to find a best performing chart so that all the valuable information that is not easily available elsewhere will get at your fingertips.
Different type of price patterns
1. Historical pattern: Give preference to history chart. There are a number of successful price patterns that repeated themselves again and again. The past price patterns of great stocks can be used as models for your future selection. This is because it is a truth. The history repeats itself.
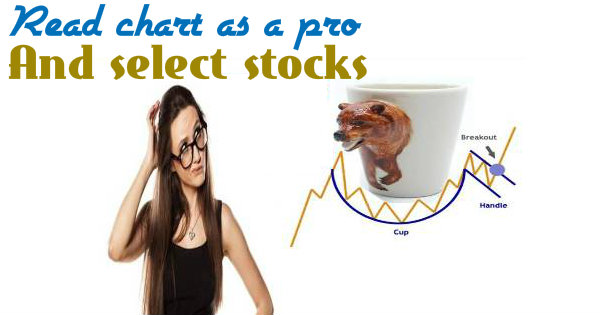
2. Cup with Handle pattern: Life period of cup pattern last from 7 weeks to 65 weeks. Strong price patterns always have a clear and unique direction and a definite price uptrend former to the beginning of its base pattern. For finding a clear uptrend, confirm three things, a 30% increase in price, improving relative strength, a substantial increase in trading volume. In most of the cases, the bottom portion of the cup should give “U” appearance rather than a very narrow “V”.
More than one or two weeks will take for the formation of cups handle. It indicates a downward price drift. However, the cups without handle have a higher failure rate. Failure prone can be identified with the help of handle area. If the handle is formed in the lower half of an overall base or fully under the stock’s 10-week moving average price line then you can fix it is a failure prone. Handle should always form in the upper half of an overall base or completely above the stock’s 10-week line.
One more failure condition is handles formation with consistent wedge up. This has a higher probability of failure.
Patterns with Tight Price Areas
Sometimes there should be some tight areas in the price patterns of those stocks which are under accumulation. Tightness in a weekly chart is the small price variations from high to low for the week with either the previous week‘s close or several consecutive week’s price closing. If there is a wide spread between the weeks’s high and low points in the base price pattern it will not succeed frequently when it breaks out. In fact, a part-time chartist will not notice the difference. The stock can go upto 5 cent to 15 cent before it breaks or fails.
3. Saucer with handle price pattern: Similar to cup with handle there exist Saucer with handle pattern. Here the saucer part tends to stretch out over a longer period of time. And the pattern becomes shallower. Buy area is the handle area.
4. Double-Bottom price pattern: This price pattern looks like the letter “w” in English alphabet. In this pattern the first bottom and second bottom of the W should match. Sometimes double-bottom patterns also have handles, but it is not essential. The horizontal length and depth of double bottom is similar to that of cup formation. The buy area of this pattern is on the top right side of the W. and if the double-bottom pattern has a handle then the peak price of the handle is the buy point.
5. Flat-Base Price Structure: It is another rewarding price pattern. This type of pattern gives you a second chance if you miss one good chance for entry in cup with handle pattern. It is usually occurs after a stock has raise 20% more off a cup with handle, saucer with handle or double-bottom. It moves sideways for at least five or six weeks. If you miss first chance in a cup with handle pattern keep your eye on flat-base it gives you a second opportunity to get on board.
This different chart pattern will help you to select a best performing stock. If you have a best accurate software in your hand then that will make you a professional trader. You can find more about a best buy sell signal from the following blogs.
See the performance yourself, CLICK HERE to contact us and FIX UP a FREE REAL TIME DEMO of WinTrader BUY Sell signal software in FOREX, MCX, NSE, COMEX, NCDEX, MCX SX markets.
Tags: accurate buy sell signal software in MCX Commoditiies, automatic buy sell signal generating software, best commodity buy sell signal software, best share/stock buy sell signals in India, India's best buy sell signal software, MCX Buy sell signal software, most accurate buy sell signal software, WinTrader V7.0 the best trading systems for Indian Stock markets