WinTrader V7.0 screen looks like below:
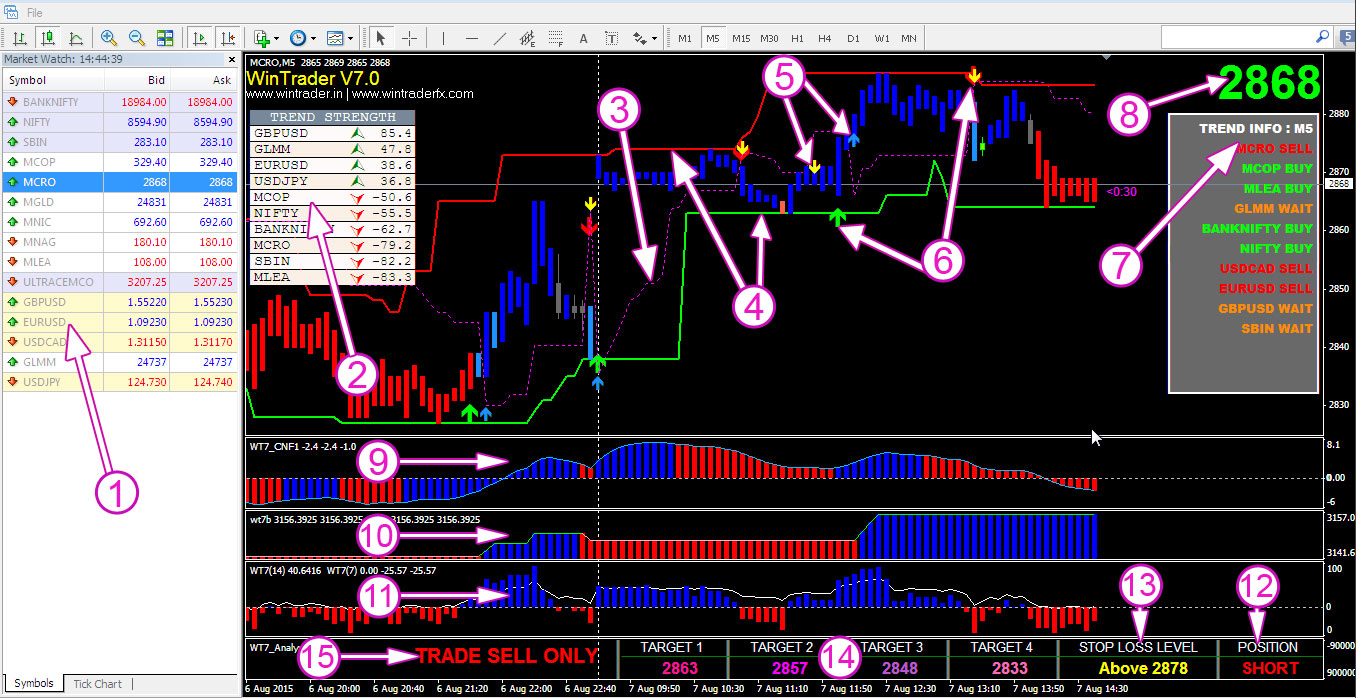
1. Market Watch
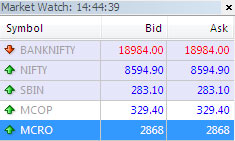 You can see your selected stocks / commodities / currency pair’s price in real time; you can add and remove your scrips by right click on the market watch and select Symbols or use the keyboard shortcut CTRL+U. You can create new chart from the market watch symbols by right click on market watch and select Chart Window
2. Trend Strength
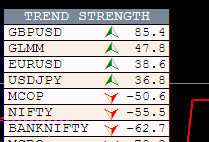 Trend strength shows you clear idea about real time fast moving stocks / commodities / currency pairs that you selected for your trading. You don’t need to look each chart to get idea about the fast moving scrips. You can see all in one place.
You can add as many scrips (maximum 10) by selecting properties of the indicator.
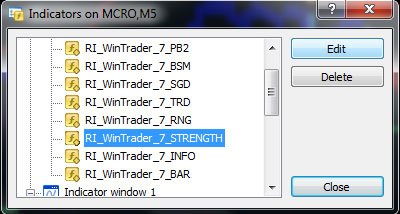
2a. Procedure of adding Symbols in TREND STRENGTH
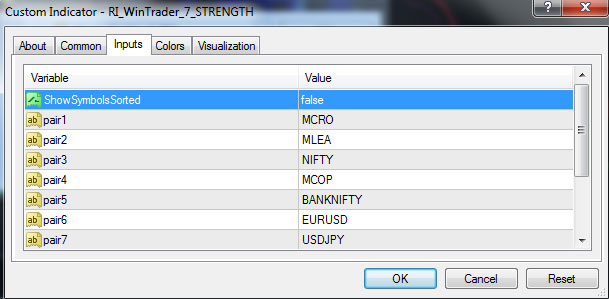
Right click on chart window then select Indicators List or use the keyboard shortcut CTRL+I, then select the indicator named RI_WinTrader_7_STRENGTH, then click on edit button, you will get the screen look like below.
Screen (2a-1): Select the Indicator RI_WinTrader_7_Strength and click Edit
Screen (2a-2): The selected Indicator’s property window will show up you can see and change the options here.
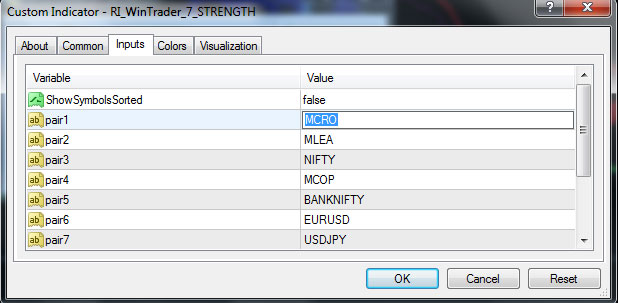
Screen (2a-3): You can modify the default symbol name with your own, before doing this you need to add the symbols in your market watch and you need to enter the symbol here by double click on the selected pair and enter the symbol code that shows exactly in your market watch. You can change up to 10 scrips like this.
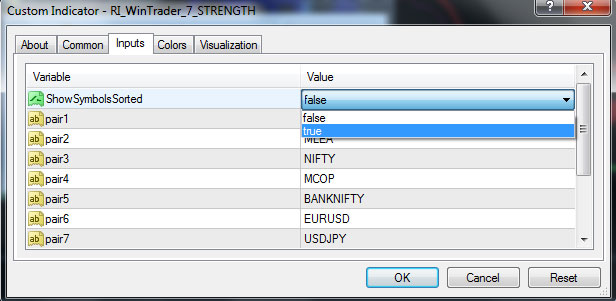
Screen (2a-4): You can choose the selected symbols should be sorted in order to the Trend Strength value, if you want to sort you need to select true otherwise select false. The default option is TRUE.
3. Buy / Sell Area Confirmation
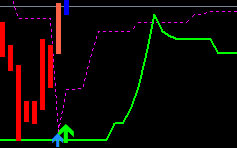
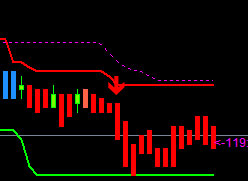 This is the most important indicator for the first confirmation, this indicator plotted in dashed magenta line as shown in image. You need to take buys only when the candles plotted above this Magenta line, like wise for sell the candles should be below the magenta line as show in left image. This is most important rule in WinTrader V7.0, don’t enter in trade opposite to this confirmation.
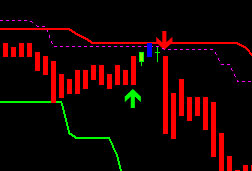 Example: From the screen shows right side, there is two signals generated BUY (UP Green Arrow) and SELL (Down Red Arrow). We take only the SELL signals, because the candles are below Magenta dashed line (SELL ZONE) and we won’t take BUY signal, since the candles are in SELL ZONE. You need to take BUYs when the candles are in BUY ZONE (above magenta dashed line) like take only SELLs when the candles are in SELL ZONE (below magenta dashed line).
4. Range Market Identifier
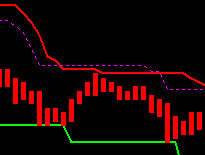 This indicator will plot RED and GREEN thick line on chart. This lines are plotted with the complex algorithmic calculation from different indicators in WinTrader 7.0. This two line (RED and GREEN line) will guide you to identify range markets easily, range market means the market has no major movements, in range markets there is chance to lose the trade, so it’s better to avoid range market while in trading. If the gap between RED and GREEN line is too close, that means the price is in range, the gap wide in between lines means its trending, if you get signals in trending market the accuracy will be high.
5. BUY/SELL Zone confirmation arrows
This indicator plots two arrows in Blue and Yellow colour whenever the BUY and SELL zone changes. WinTrader V7.0 will plot Blue arrow when the zone changes from SELL zone to BUY zone, likewise Yellow arrow plots when BUY zone changes to SELL zone as show in the screens below
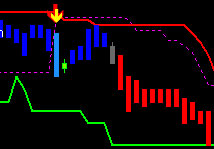 Screen (5-1): SELL ZONE activated
 Screen (5-2): BUY ZONE activated
6. BUY/SELL Arrow with alert message and sound
This is one of the most important indicator in WinTrader V7.0, this will plot GREEN and RED arrows as shows in screen below, whenever BUY/SELL signal generates it will plot GREEN arrow for taking LONG trade and RED arrow for taking SHORT trade, the arrows will plot with POP up alert message and sound. So you don’t have to look all the time in screen, whenever buy /sell signals are generates you will get alert sound and message. Remember we need to satisfy other confirmations, that should be favor in the direction of buy sell signal generated to take the signal for trade or not.
BUY Signal (GREEN arrow)
SELL Signal (RED arrow)
7. Trend Info
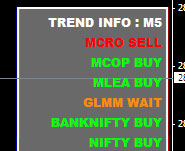 This indicator will shows whether the selected stocks / commodities / currency pair is in BUY / SELL / WAIT in the selected time frame. You can watch your selected scrip’s trend in one place, You can add and remove the Symbols by selecting properties of indicator named RI_WinTrader_7_INFO as described below, and also you have the option to change the time frame.
WinTrader V7.0 suggests the Trend Info time should be the time frame you selected for trading or the next higher time frame. That means if you look for trade in 5M chart, then the TREND INFO’s time should be 5M or next higher 15M.
7a. Procedure of adding Symbols and change time in TREND INFO
Right click on chart window then select Indicators List or use the keyboard shortcut CTRL+I, then select the indicator named RI_WinTrader_7_INFO, then click on edit button, you will get the screen look like below.
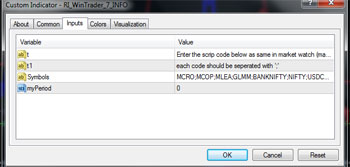
Screen (7a-1): Select the Indicator RI_WinTrader_7_INFO and click Edit
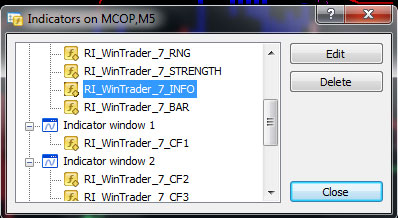
Screen (7a-2): The selected Indicator’s property window will show up you can see and change the options here.
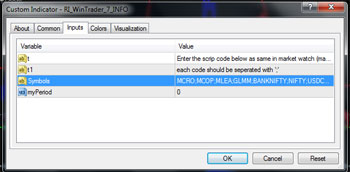
Screen (7a-3): You can modify the default symbol name with your own, before doing this you need to add the symbols in your market watch and you need to enter the symbol here by double click on the selected pair and enter the symbol code that shows exactly in your market watch. The symbol code should be separated with semi colon (;) as below
MCRO;MCOP;MLEA;GLMM;BANKNIFTY;NIFTY;USDCAD;EURUSD;GBPUSD;
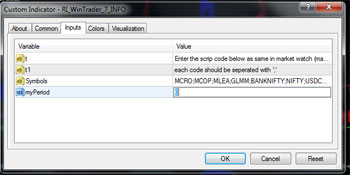
Screen (7a-4): You can change the time frame in which the TREND INFO should show the trends, 0 means the time frame of chart you selected, and if you want to see the trends in 15 minutes, you need to change it to 15, the time should be entered in seconds, means if you want to see the trends in FOUR HOUR, then you need to enter as 240 (4hrx60second). The default option is “0” means the time frame of chart.
8. Market Price (Magnified)
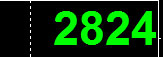 It shows the current price of selected charts scrip in magnified style, this will helps to easy your eyes to watch the price fluctuation.
9. Filter 1
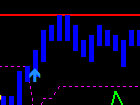
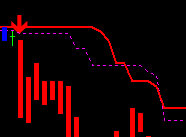
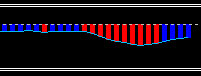 This is the first filter and one of the most important filter, don’t trade against this FILTER. In this filter for taking LONG position the graph should be above white dashed line with blue colour and for sell this should be below with red colour. This filter is double confirmed when the blue line penetrates white dash line from below to above for BUY and from above to below for SELL, for getting clear idea, look at the below images for the DOUBLE CONFIRMED filter.
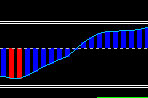 Filter 1 PERFECT BUY
 Filter 1 PERFECT SELL
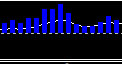
10. Filter 2
In second filter, for taking LONG position the histogram bar should be in BLUE colour and for SHORT position this should be RED colour. Look at the image below to know more about FILTER 2 in detail,
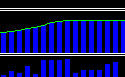
Filter 2 : BUY
 Filter 2 : SELL
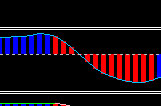
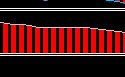
11. Filter 3
Third filter same as Second filter, for taking LONG position the histogram bar should be in BLUE colour and for SHORT position this should be RED colour. Look at the image below to know more about FILTER 3 in detail,
 Filter 3: BUY
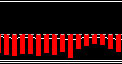 Filter 3: SELL
12. Filter 4
Fourth filter shows the current trend in text format like LONG or SHORT, there is no confusion for taking BUY entry this filter should be shows LONG and for SELL entry it should be SHORT. This filter directly relates with the FOUR target levels and Stop Loss levels, whenever FILTER 4 changes the trend, the targets and stop loss will change accordingly, look at the image below,
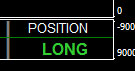 Filter 4: BUY
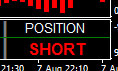 Filter 4: SELL
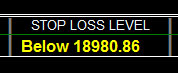
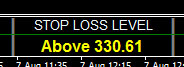
13. Stop Loss (Trailing)
WinTrader V7.0 automaticaly suggests the STOP LOSS level with the complex calculation from the past price movements, the stop loss will change when the market moves to minimize the risk in loss when the stop loss hit. The stop loss level directly relates to FILTER 4, means whenever the FILTER 4 changes the Stop Loss will change accordingly, Look at the image below,
 Stop Loss for BUY
 Stop Loss for SELL
You must enter STOP LOSS according to this whenever you enter new trade and FITLTER 4 confirms with current trade
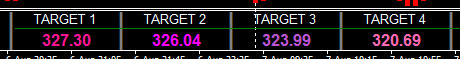
14. Targets
WinTrader V7.0 automaticaly shows the FOUR levels of targets, you can choose any targets levels according to your risk taking capacity. This target levels are directly relates to FILTER 4 like stop loss, so for getting correct target levels, the FILTER 4 should confirm with the current trade entry, Means FILTER 4 should show LONG for BUY entry and SHORT for SELL entry.
15. BUY / SELL area confirmation TEXT display
This is the text version of indicator we discussed in Point No: 5. You can easily identifies whether the current candle is in BUY ZONE or SELL ZONE. So you can easily and fastly decide the generated BUY SELL signals that we discussed in Point No:6.
 Candles are in BUY ZONE
 Candles are in SELL ZONE
Request you to look down to get detailed demonstration and live screen shots of a perfect entry, stop loss level and target level setup in WinTrader V7.0. This will clear all your doubts. WinTrader V7.0 is programmed with most complex algorithms and we put maximum efforts to visually implement all our complex programs with alerts and signals that everyone easy to understand and use.
Perfect Buy Entry Setup Taken From Real Market
The screen shot below taken from live market in Copper (MCX INDIA) from 5M charts on 10th August 2015, as you see the past two signals (vertical magenta line) had been worked well on 07th August 2015.
And now we got a Perfect BUY Entry setup on 330.00, our all confirmation and filters we discussed above satisfies now, so we made and BUY entry at 330.00.
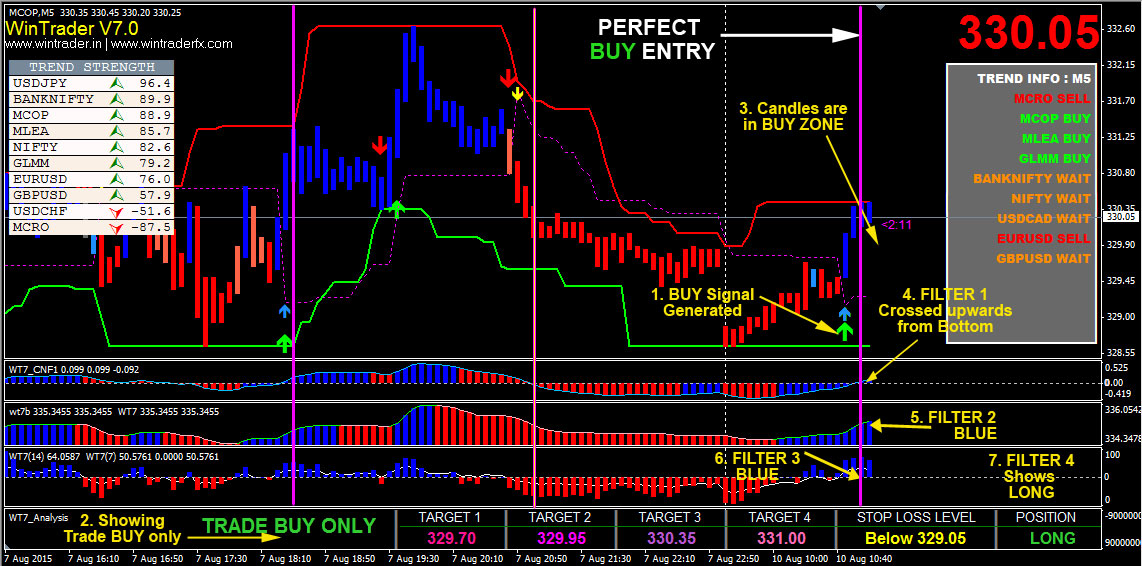
The BUY signal generated on 330.00 and the Stop Loss is below 329.05, so we put stop loss at 329.00, this is one point in copper we consider in risk, when look in to the targets, the first three target is not favorable to me, considering my risk reward ratio, So I am taking target 4 as my profit booking level, and remember WinTrader V7.0’s the Stop Loss is trailing stop loss, that means the stop loss will be change when the market moves, so we need to change the stop loss in our terminal whenever the stop loss level change, this way we can increase the risk reward ratio and make maximum profit with low risk.
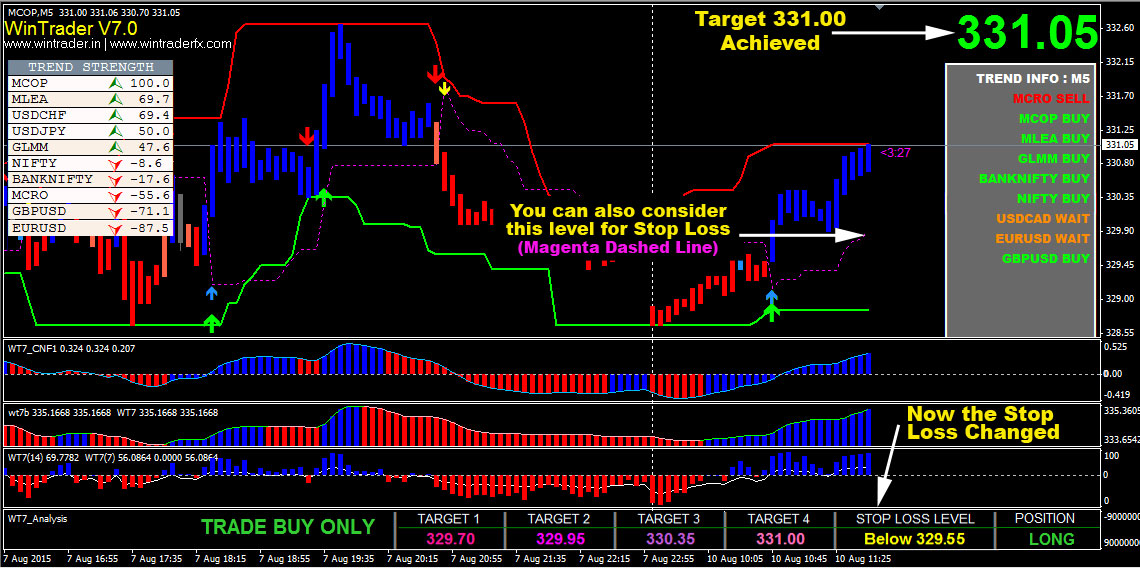
After 45 (approx) minutes after the BUY entry, the STOP LOSS LEVEL changed to “Below 329.55”, as soon this been changed we need to update stop loss in our terminal to 329.50, so now the risk is only 0.5 points and our reward is 1.0 point, that means the risk reward ratio is 1:2 (profit point is double from the stop loss point), this ratio is most good in day trading. Look at the screen below,
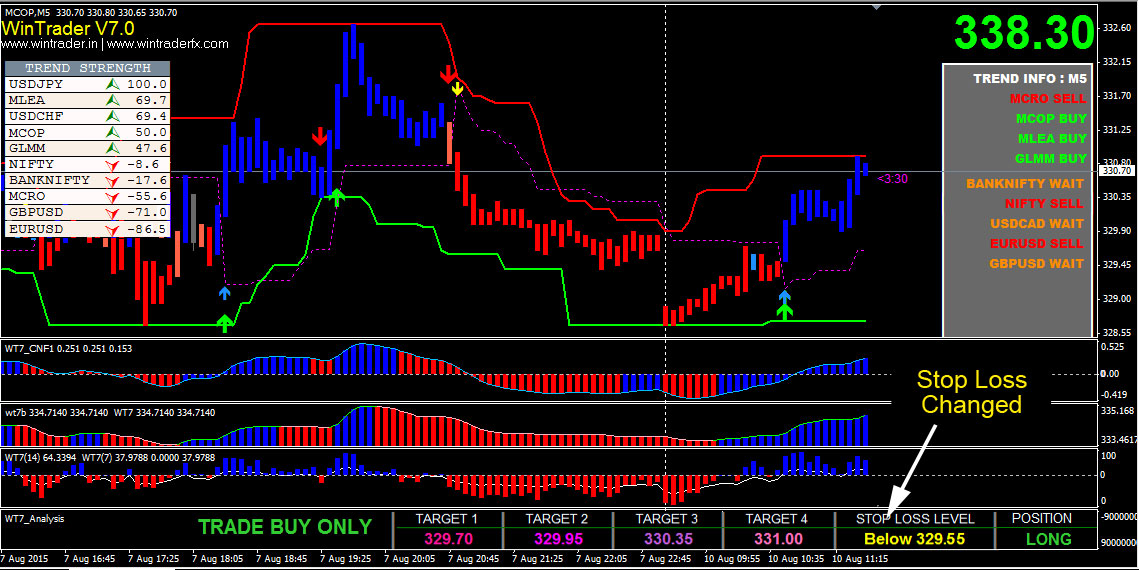
15minutes (approx) after we updated Stop Loss, our target of 331.00 has been achieved with the risk reward ratio of 1:2. This is the power of WinTrader V7.0, whenever the BUY signal generated double confirmed and all the FOUR FILTERs satisfies with the current signal, then the accuracy will be above 97%. See the screen shot below
Thanks for taking time to read this tutorial, Wish all the success in trading and make consistent profit from trading.